Introduction
The Electrical, Computer and Telecom Engineering group at the University of Wollongong recently completed a study to improve the reliability and repeatability of a functional capacity assessment using inertial sensors through objective measurement of a subject’s performance. Functional capacity assessment measures the performance abilities or functional limitations of an individual experiencing for example lower back pain (LBP). This assessment is typically used in occupational, sport or exercise settings.
Background
Many job operations and activities of daily life require lifting. Patients with chronic low back pain (LBP) often have limited lifting capacity. Various lifting tests have been developed for functional capacity assessment, particularly for patients with LBP. The Progressive Isoinertial Lifting Evaluation (PILE) is a widely accepted assessment. In the PILE test, the subject implements a sequence of well-defined incremental weight lifting exercises. The evaluation determines whether aerobic capacity or neuromuscular fatigue is the limiting factor in performing the task. While quantitative, this test is still subjective (rather than objective) as it represents the clinician’s view of the subject’s performance.
The primary aim of this study was to improve reliability and repeatability of PILE through objective measurement of a candidate’s performance, as compared to a clinical assessment.
Methods
PILE consists of lifting progressively heavier weights in a plastic container. It consists of a lumber test, lifting the boxes from the floor to the waist and a cervical test lifting from waist to shoulder height. Each individual PILE sequence can be further divided into six stages. The weight is increased at a rate equivalent to the initial load every 20 seconds, at the rate of four lifting movements in each 20-second interval. The test is stopped when either psychophysical, aerobic or safety endpoint is reached.
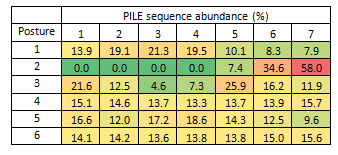
Table 1
The movement of the subject performing PILE sequence was recorded using the Xsens MVN. In all, seven such PILE sequences were completed. This kinematic data was available from the open XML file format, MVNX and was subsequently used in a program coded in MATLAB.
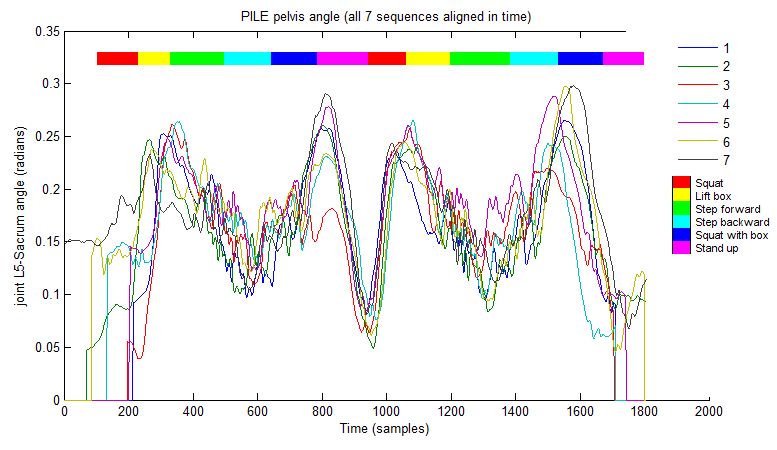
Figure 1
The pelvis lateral tilt for all the seven PILE sequences aligned in time, was plotted and compared as seen in Fig. 1. A pair-wise comparison of the pelvis lateral tilt for each of the initial six stages was made, with the final seventh PILE stage as seen in Fig. 2.
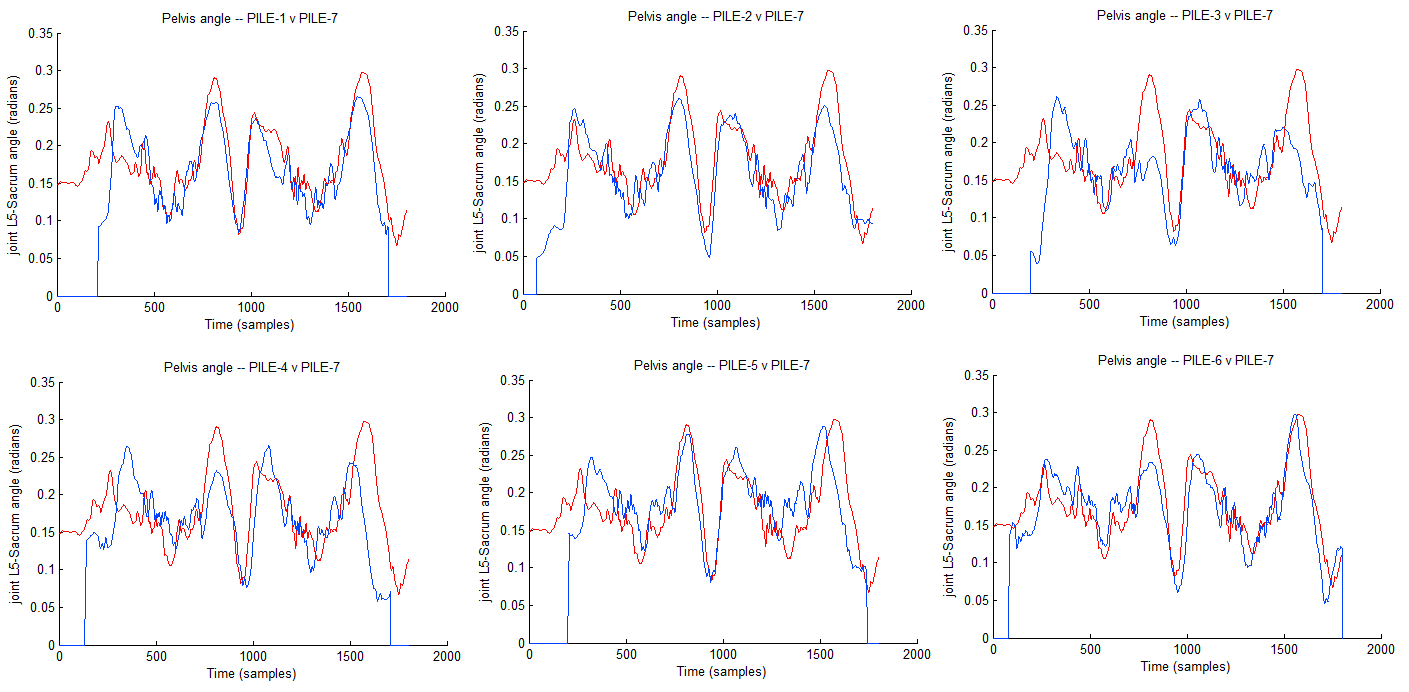
Figure 2
The posture information in the data including angles and position s were modeled using Gaussian mixture model (GMM). This made it possible to identify distinctive significant postures in the PILE test with varying frequency of repetitions at different sequence of the test. Fig. 3 illustrates an example of a GMM by displaying the sequence of clusters activated through time where each data point belongs to one of a set of 6 posture groups. Furthermore, the posture labels are sorted either by abundance (sorted by abundance) as seen in Fig. 3(a) or using the first component of the data (sorted by posture), which separates standing (high number) from squatting (low number) as seen in Fig. 3(b). It can also be seen from the Fig. 3(b) that posture 2 is only activated in the last three stages of a PILE sequence. This also clearly demonstrated in Table 1, which details the abundance of each posture at each stage of the PILE test.

Figure 3 (click for larger view)
The trends of cumulative progressive posture alterations per PILE-stage were also looked at, as seen in Fig. 4. This figure details the number of state or postural changes made by the subject, during a particular PILE-sequence.
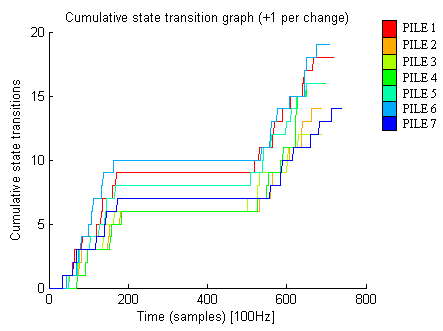
Figure 4
In order to evaluate variations in GMM, the accuracy of variance setting of the GMM (using only the angle data) was modified such that the motion sequence would be segmented into more specialized 17 postures, again each being statistically different from the other. This increased GMM model can be seen in Fig. 5.
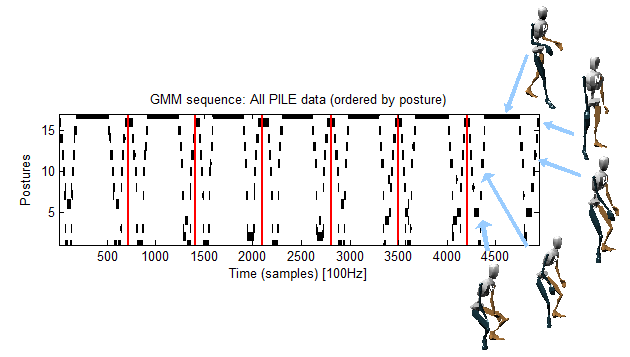
Figure 5
The phase plots of pelvis rotation against the L5-sacrum joint were also plotted and analyzed, as seen in Fig. 6. Plots for all PILE sequences can be seen in Fig. 6(a). In Fig 6(b), the first and last PILE sequences are emphasized with a greater scale.
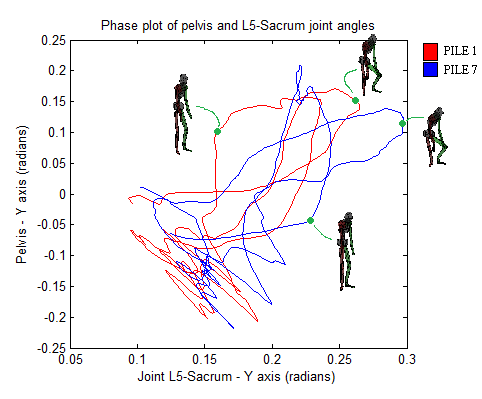
Figure 6a
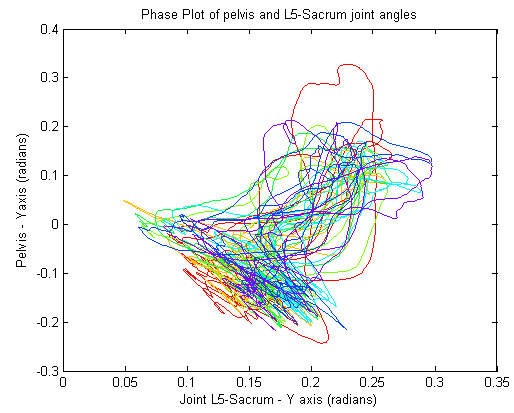
Figure 6b
Conclusions
The combined application of GMM on multiple streams of inertial motion capture data yielded a number of tractable emergent features, which enabled objective assessment of functional capacity of a human body. From the cumulative progressive alterations per PILE-stage trends, it was seen that the frequent accession and transitions between particular postural-states, formed a basic motion signature for the earlier stages of the PILE sequences, which progressively changed in the final three sequences. This can be attributed to the increasing degree of difficulty of the later PILE sequences.
Various analyses conducted on the data indicated that the captured data provided adequate information to objectively determine the failure of the subject to maintain optimal, and or correct postures within a sequence of motions, and to identify the onset of muscle fatigue within the PILE assessment.
Are you interested our solutions? Please click on the button below to contact us.
